ChartAI
August 26, 2024
ChartAI uses ChatGPT to help users create and understand charts and diagrams.
ChartAI Product Information
ChartAI is a platform that leverages ChatGPT technology to aid users in the creation and comprehension of charts and diagrams. Users can easily navigate the website to input their data or information for visualization. By engaging with ChatGPT, users can receive tailored guidance on creating specific chart types or diagrams. Key features of ChartAI encompass the generation of diverse charts and diagrams, offering insights and explanations regarding the depicted data, and providing interactive tools for customization and manipulation of visualizations.
ChartAI Frequently Asked Questions
FAQ for ChartAI
What types of charts and diagrams can ChartAI generate?
ChartAI can generate a wide range of charts and diagrams, including bar charts, line graphs, pie charts, scatter plots, flowcharts, Venn diagrams, and more.
Can ChartAI analyze my data and provide insights?
Yes, ChartAI can analyze the input data and provide explanations, insights, and trends related to the visualized information.
Is it possible to customize the visualizations generated by ChartAI?
Absolutely! ChartAI provides interactive tools and options to customize and manipulate the visualizations according to your preferences.
Can I use ChartAI for educational purposes?
Yes, ChartAI is suitable for educational purposes and can help students and educators create visually engaging representations of data or concepts.
ChartAI Website Traffic Analysis
Visits Over Time
Traffic Sources
Geography (Top 5 Regions)
Top Keywords
Alternative of ChartAI
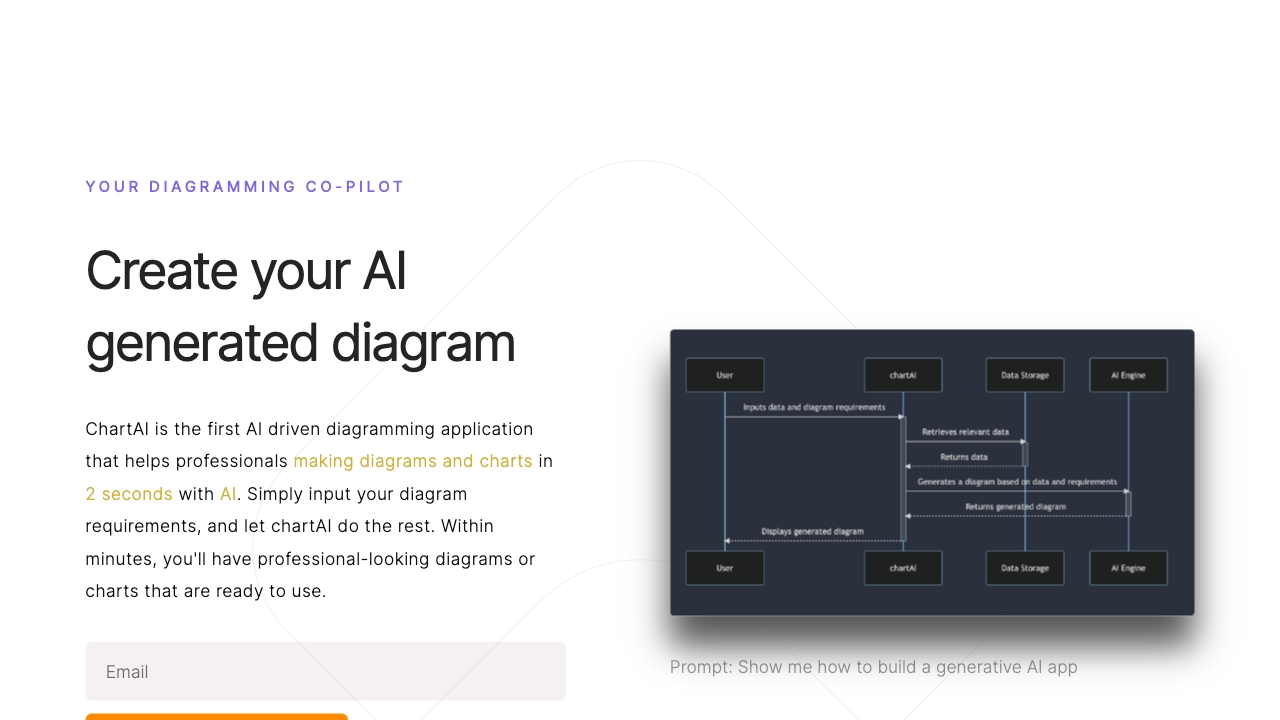
Easily create network diagrams, workflows, and relationship diagrams, and use our online tools to transform complex data into clear visuals.
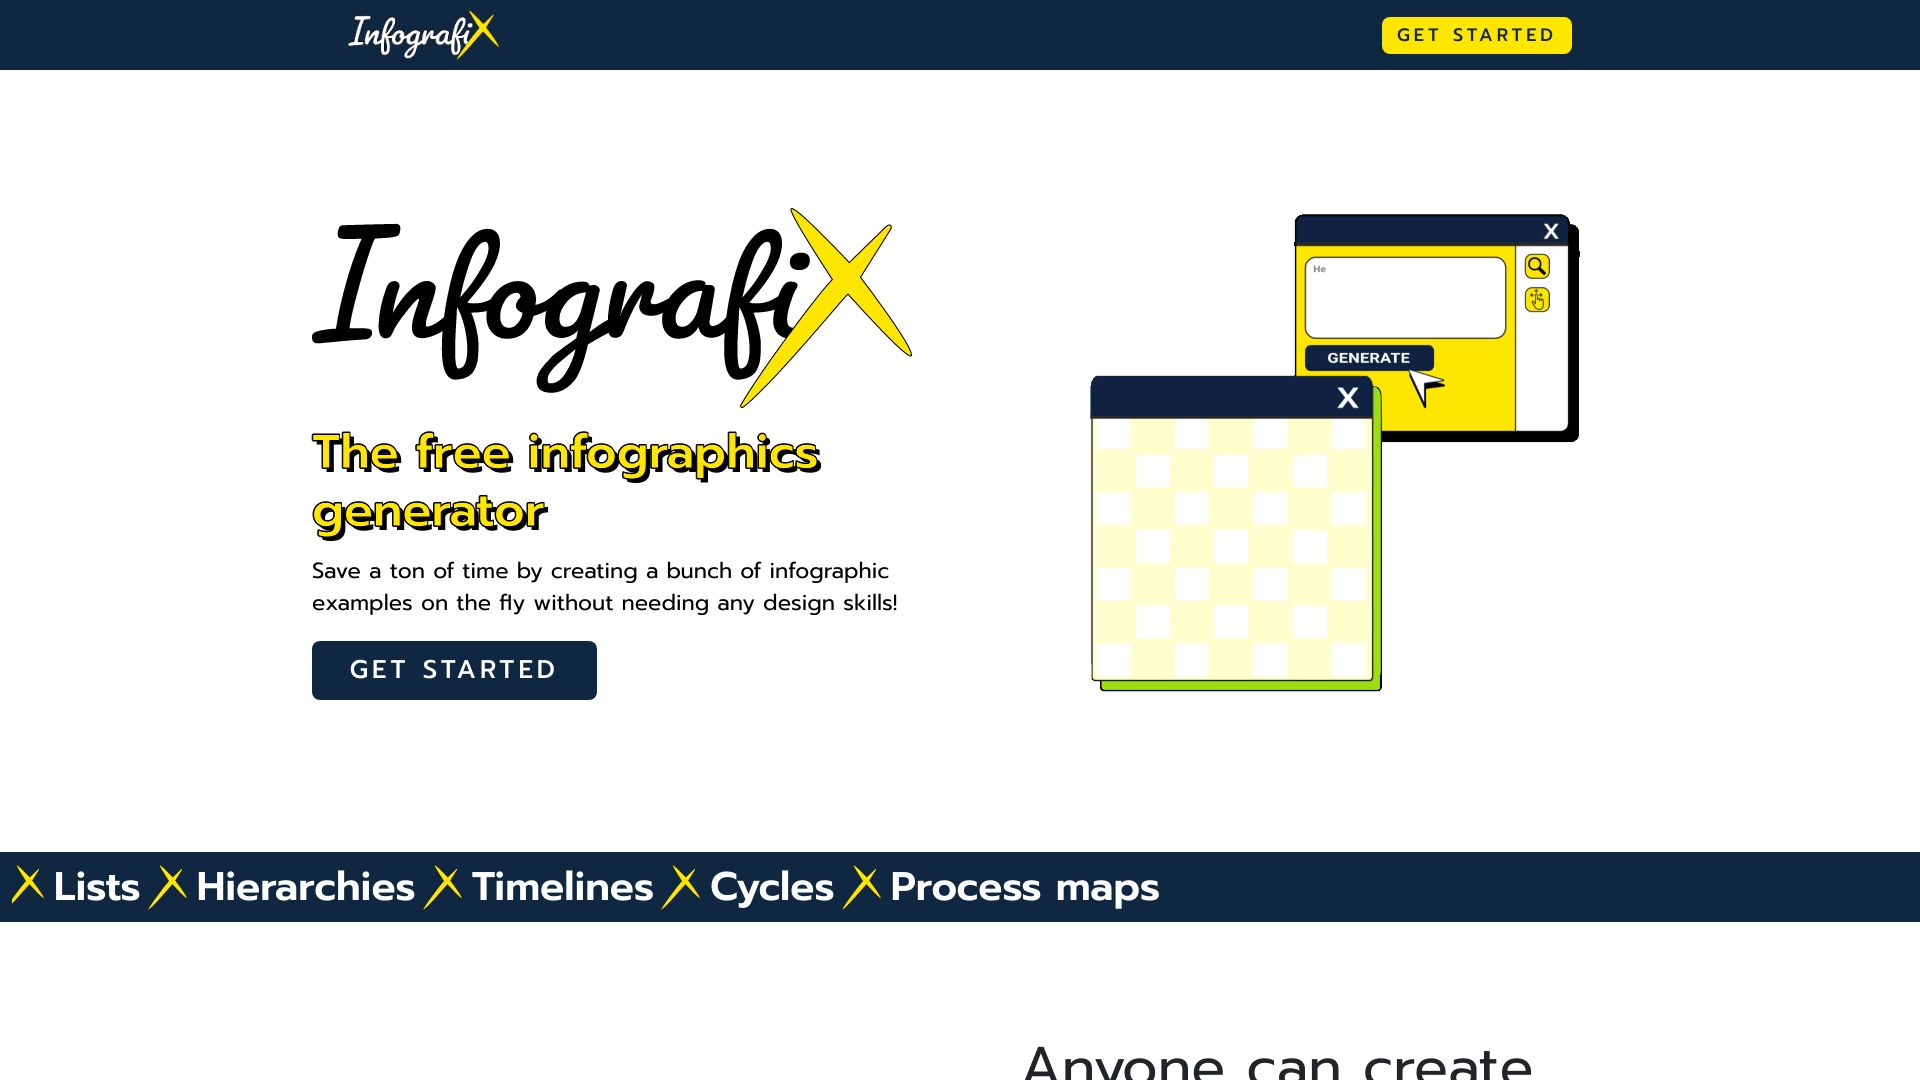
Create infographics with AI quickly.
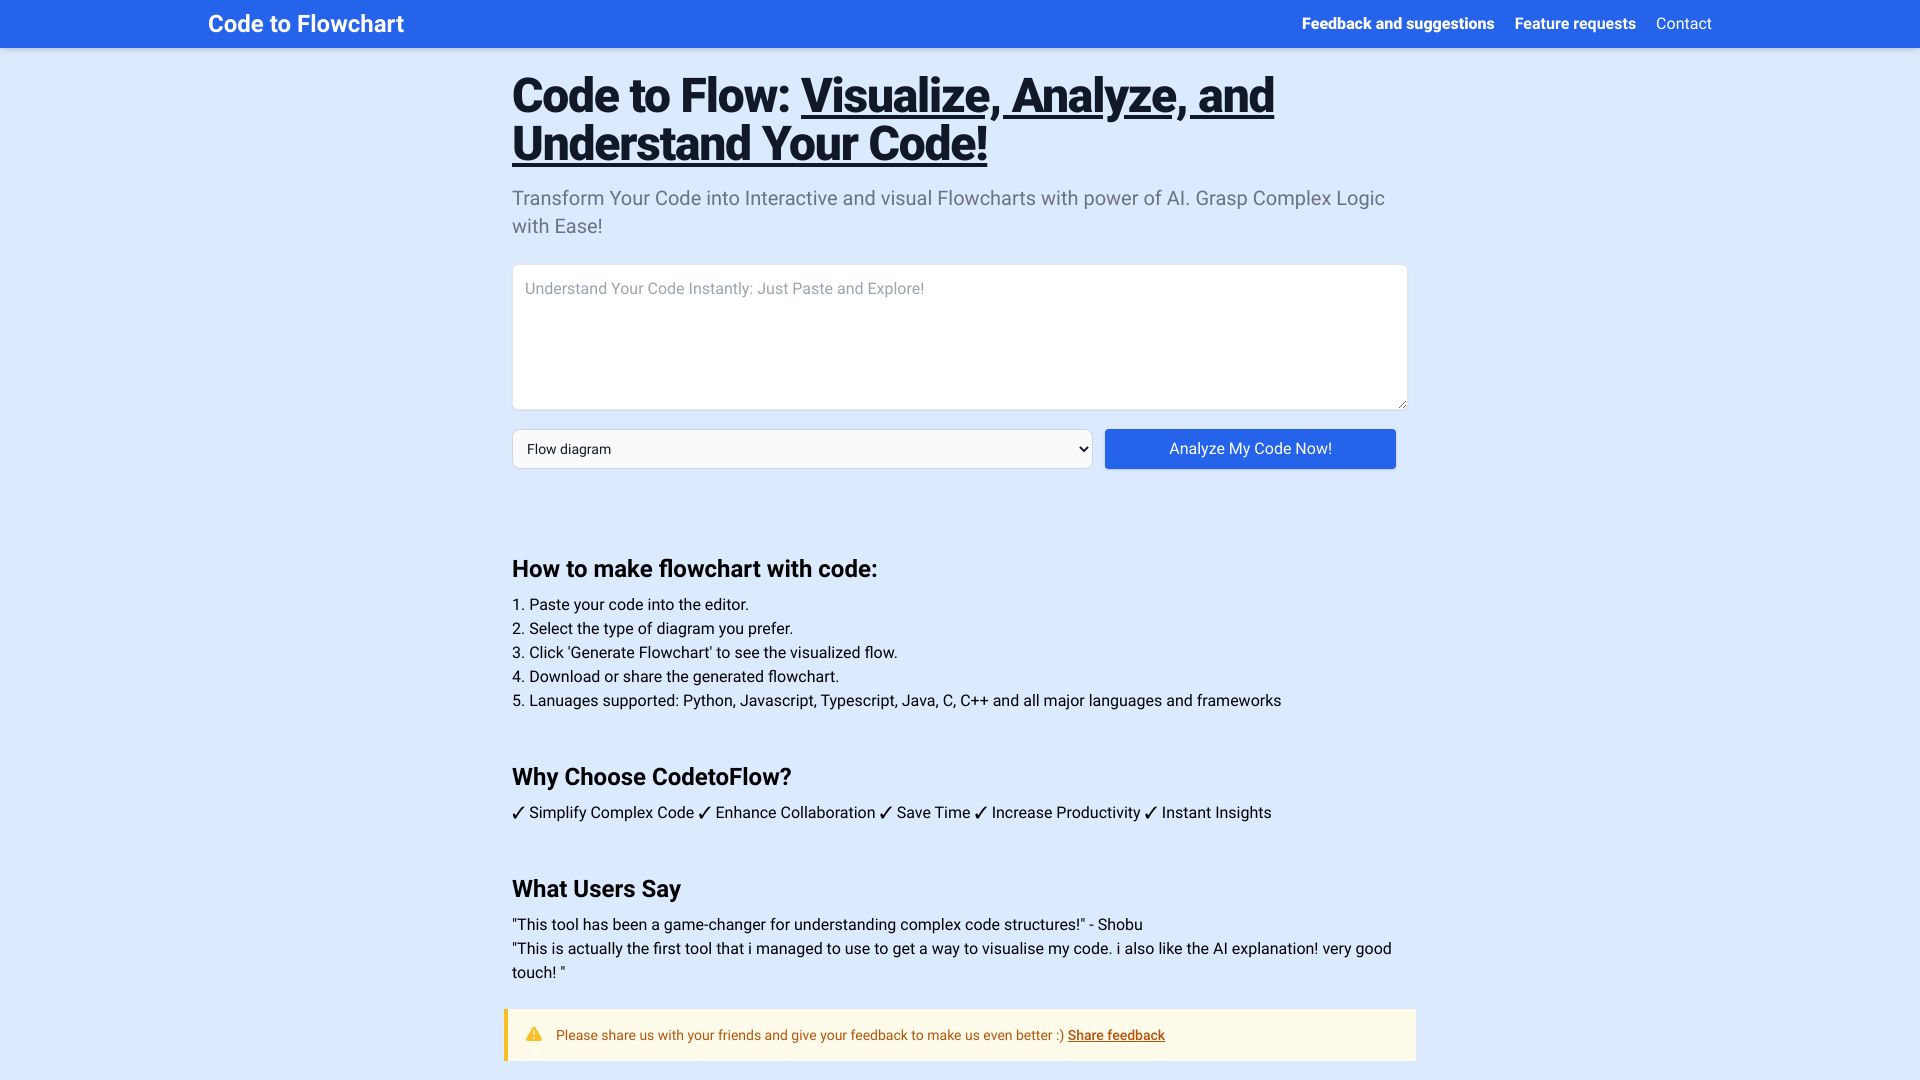
Turn code into interactive flowcharts with AI.
Convert text ideas into visuals easily.


